Jira Cloud app · Atlassian Marketplace

See delivery performance in seconds.

PulseView turns your Jira activity into delivery signals — throughput, cycle time, bottlenecks, and team health. No manual reports. No dashboard building.

Data stays in Jira 2-minute install Free trial
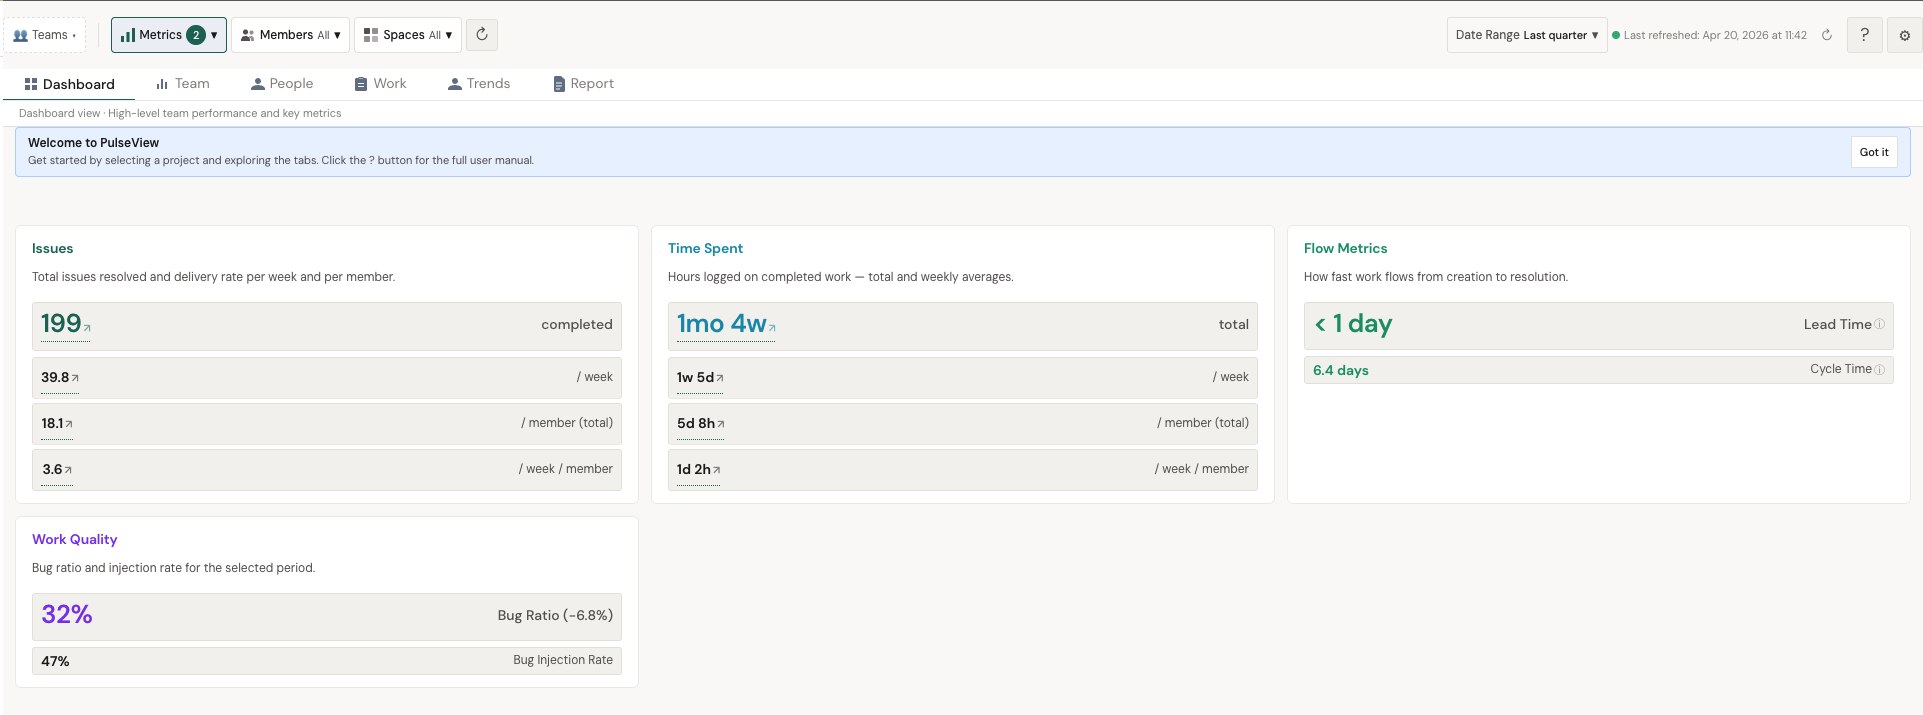
PulseView Dashboard showing Issues, Effort, Impact, Flow Metrics, and Work Quality overview
The problem

Jira shows activity. Not what changed or where risk is.

No delivery signals
Your board shows ticket status. Not whether throughput is rising, impact is falling, or cycle time is drifting.
Risk is invisible
Which team members need attention? Where is delivery concentrated? You can't answer these from a Jira filter.
Change goes unnoticed
Throughput jumped last week? Effort dropped? Jira won't flag it. You find out when someone asks.
Team health is a guess
Who's healthy, who needs attention, who's at risk. You need this weekly, not quarterly.
How PulseView helps

Delivery signals. Not just dashboards.

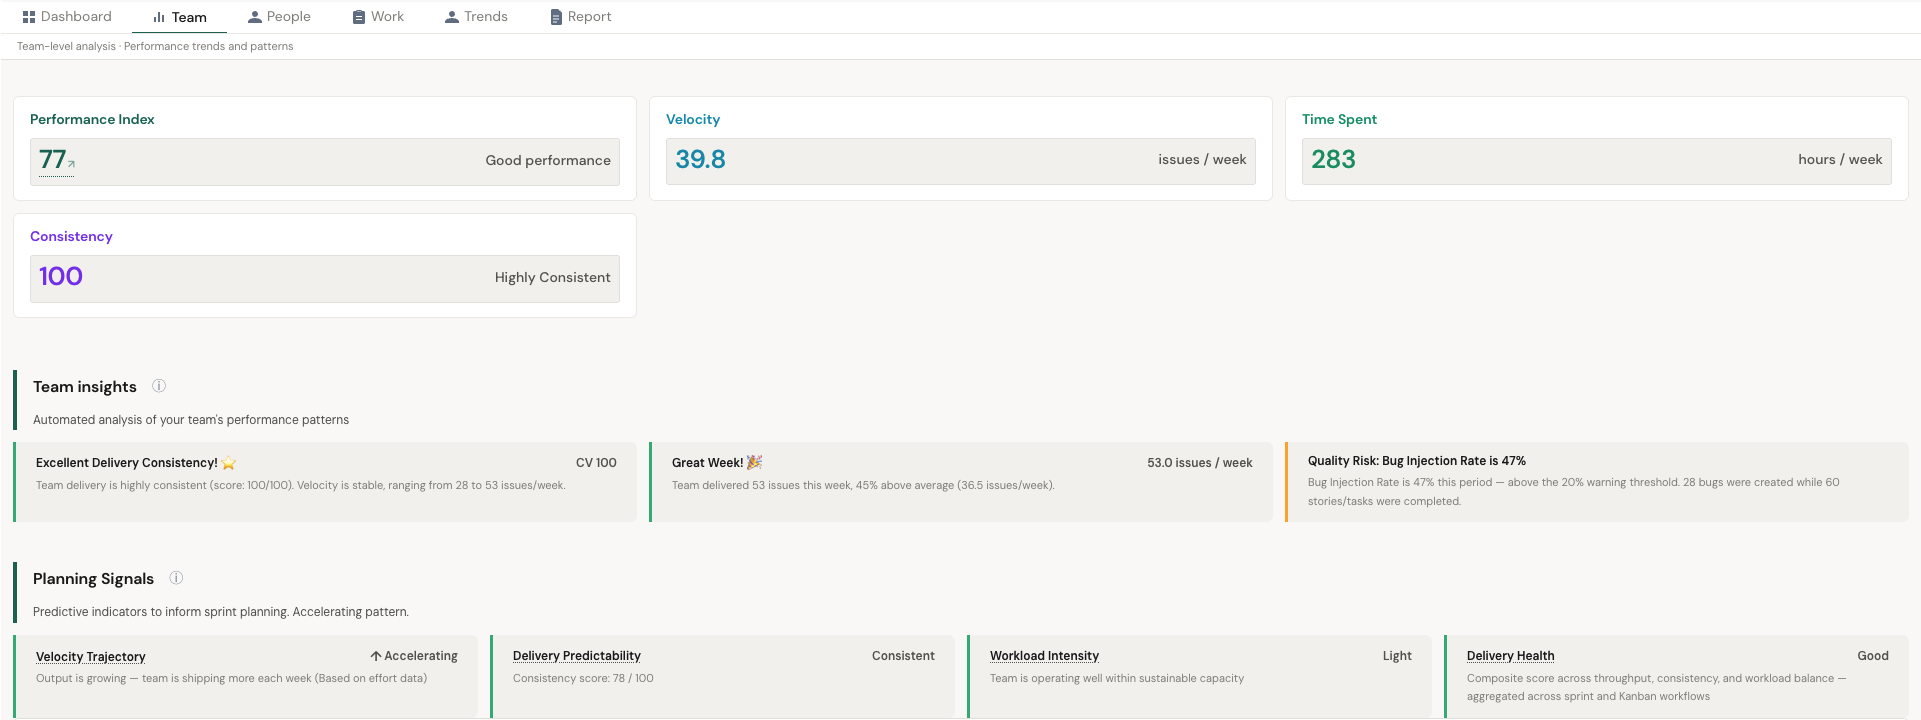
PulseView Team view with Performance Index, Velocity, Throughput, Consistency, Team Insights, and Planning Signals
Automated team-level delivery intelligence
Performance Index, velocity, throughput, consistency, and impact health — with automated insight cards that flag patterns like "Stable and Consistent Performance" or "Quality Risk." Planning signals give you delivery predictability and weekly depth at a glance.

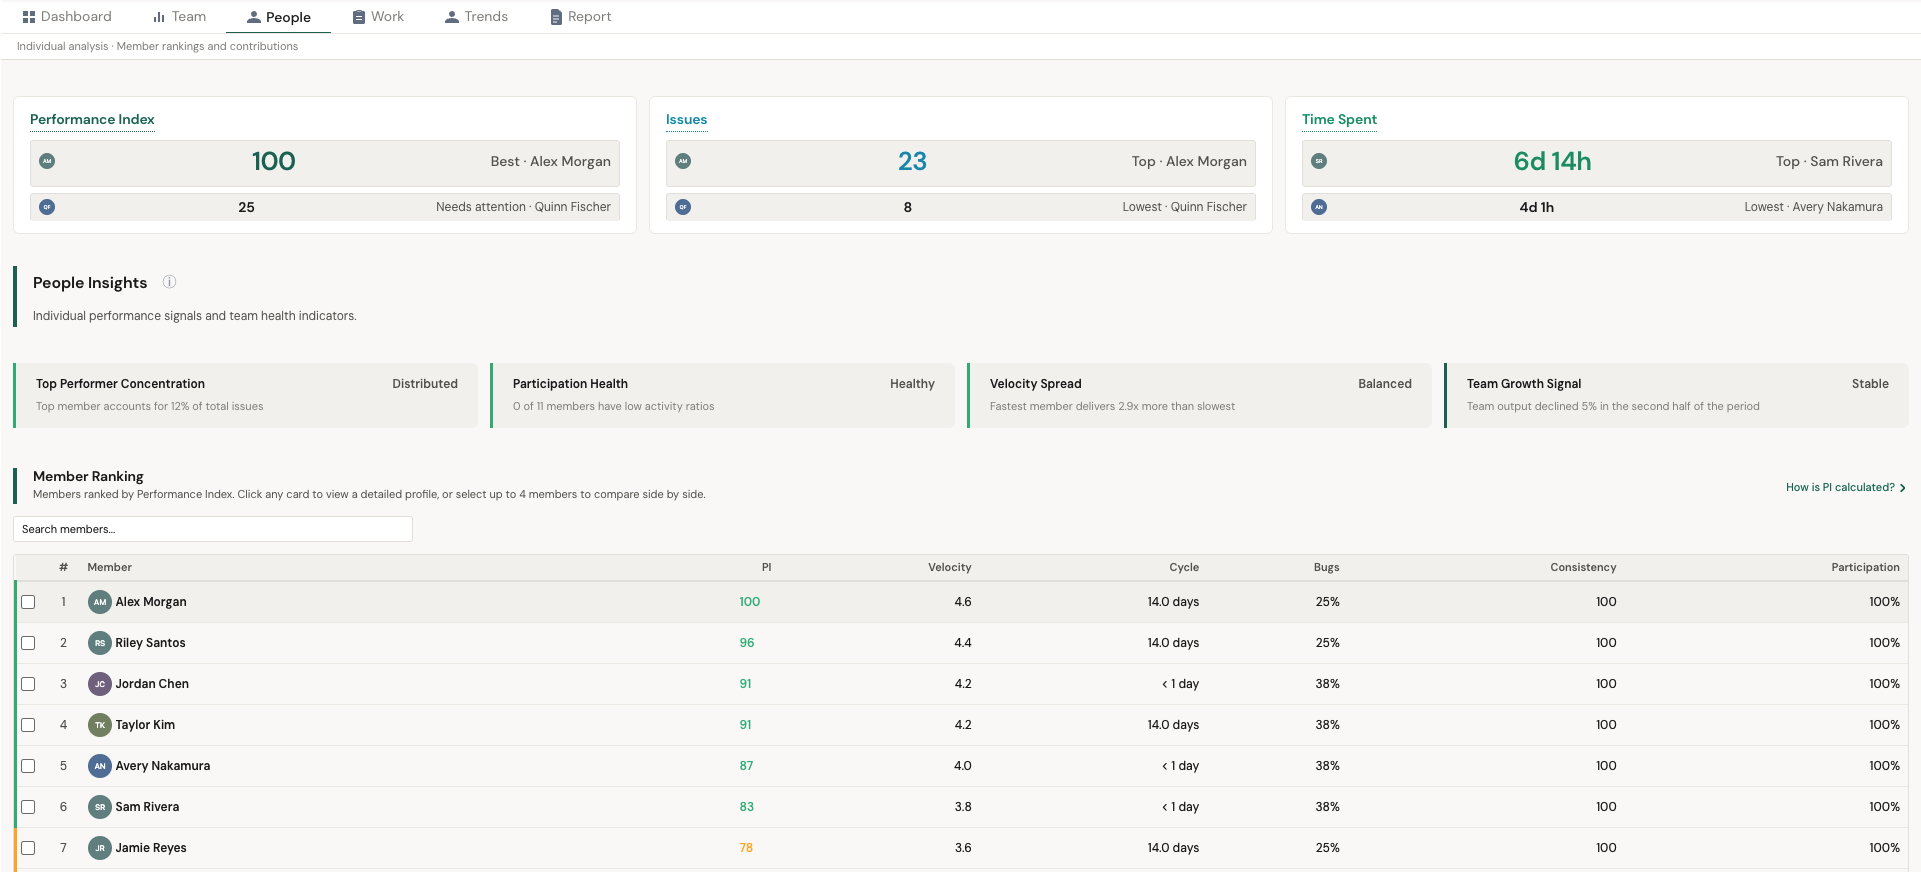
Know your people. Not just their output.

PulseView surfaces concentration risk, participation health, velocity spread, and growth signals — so you can act before problems become patterns.

PulseView People view with Performance Index, People Insights cards, and Member Ranking table
People insights and member ranking
See who's delivering, where concentration risk exists, and how participation and velocity are distributed across the team. Member ranking puts every person's metrics in one sortable table.
Every angle covered

Six views. One complete picture.

Each tab answers a different question about your delivery — from high-level health to individual cycle times.

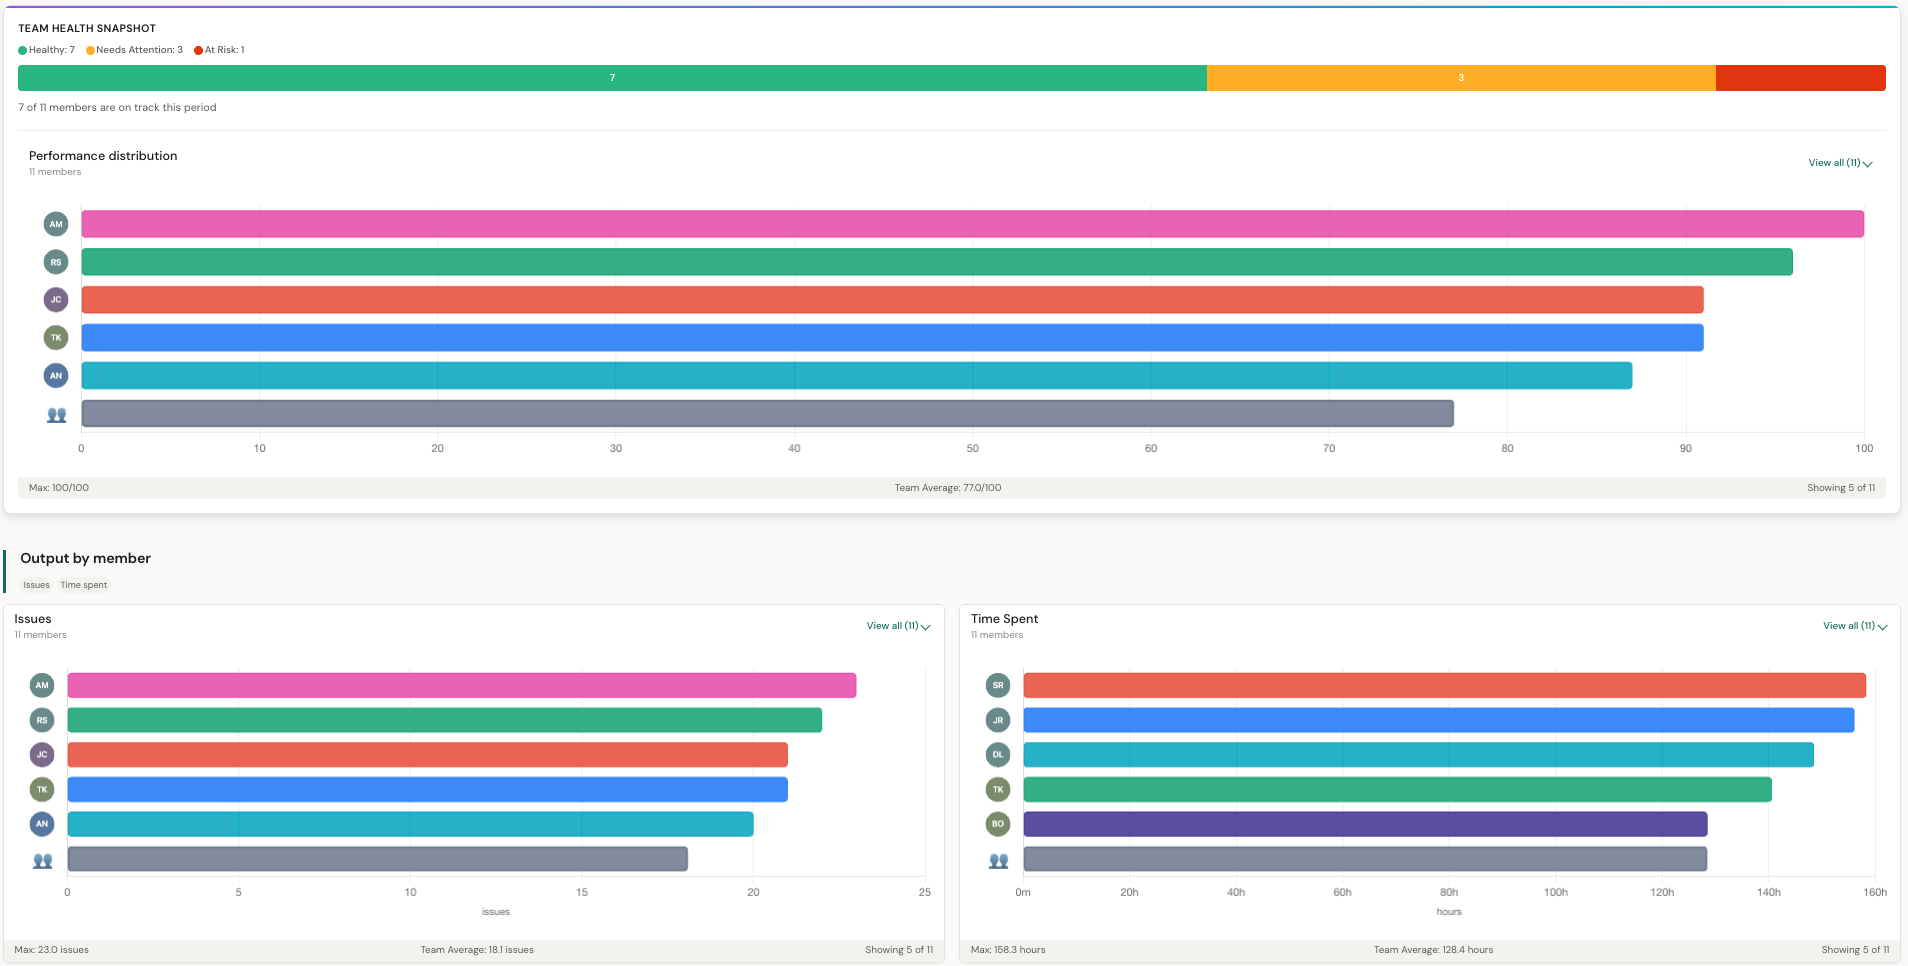
Dashboard: Team health by member, performance distribution, and output breakdown
Dashboard
Team health heatmap, performance distribution, and output by member — all in one scroll.
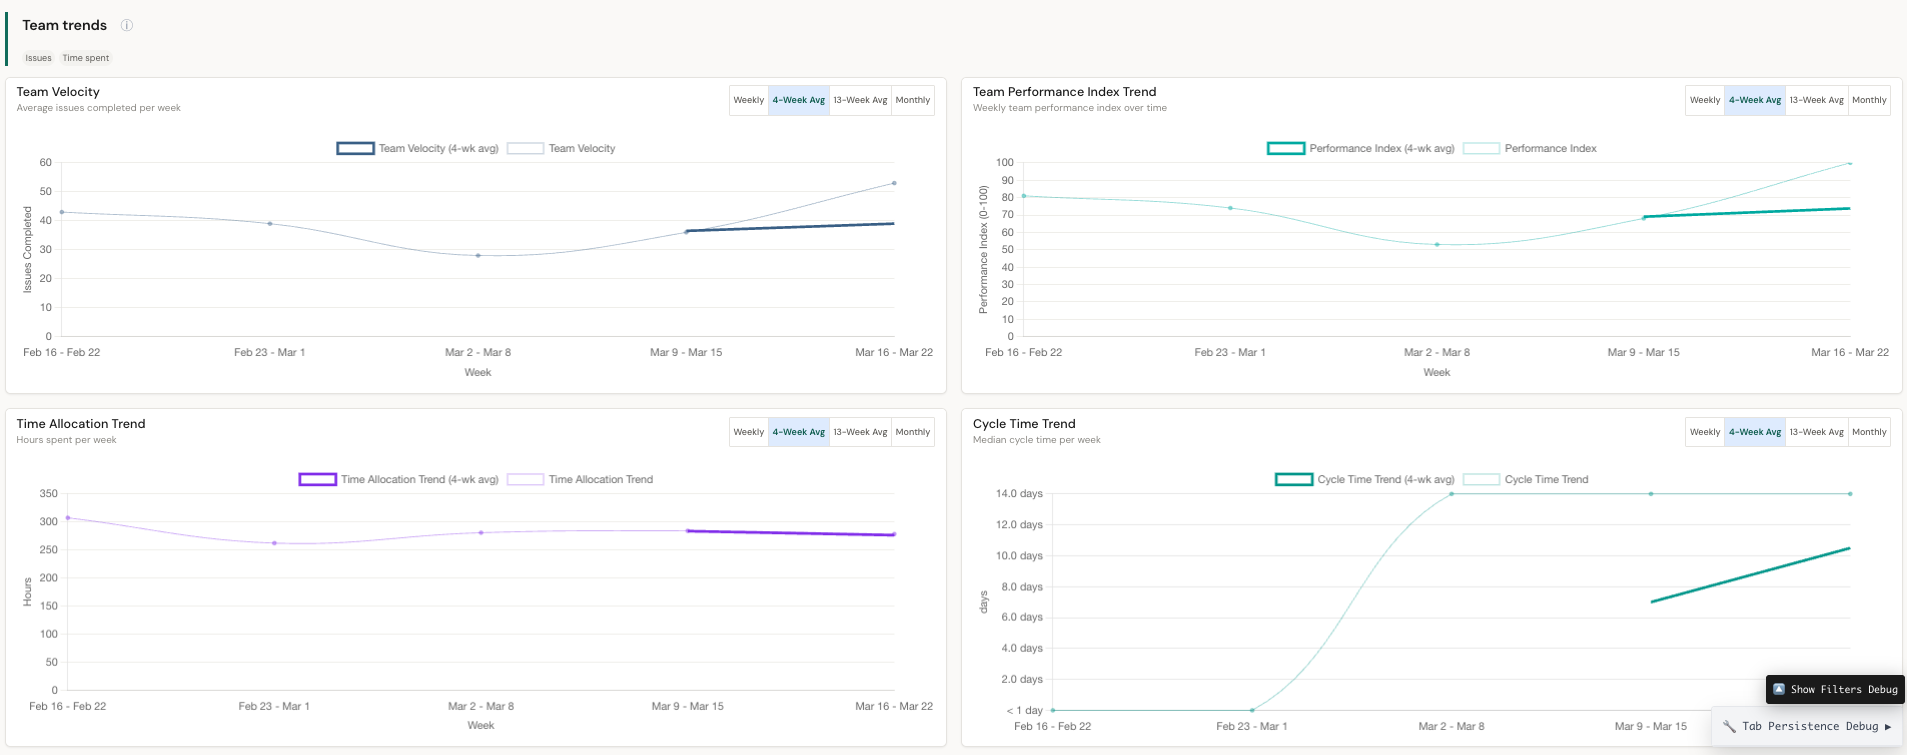
Team Trends: velocity, PI, effort, and impact trend charts
Team
Velocity trends, PI trajectory, effort, and impact over time. See where your team is heading.
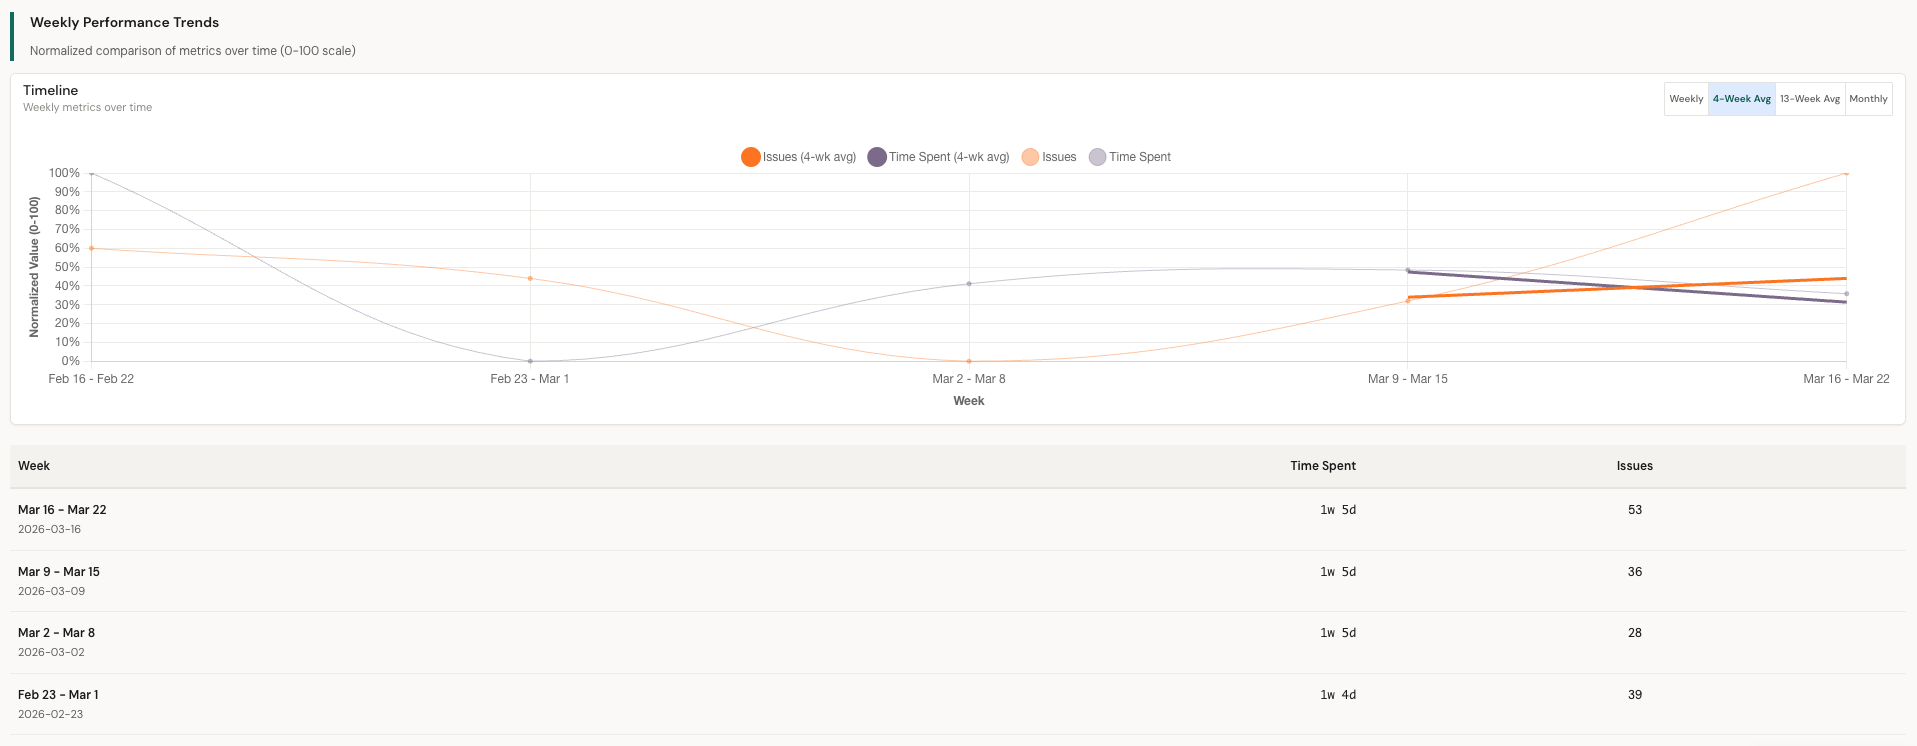
Weekly Performance Trends with normalized multi-metric comparison
Trends
Normalized weekly comparison across all metrics. Spot divergence between output and impact instantly.
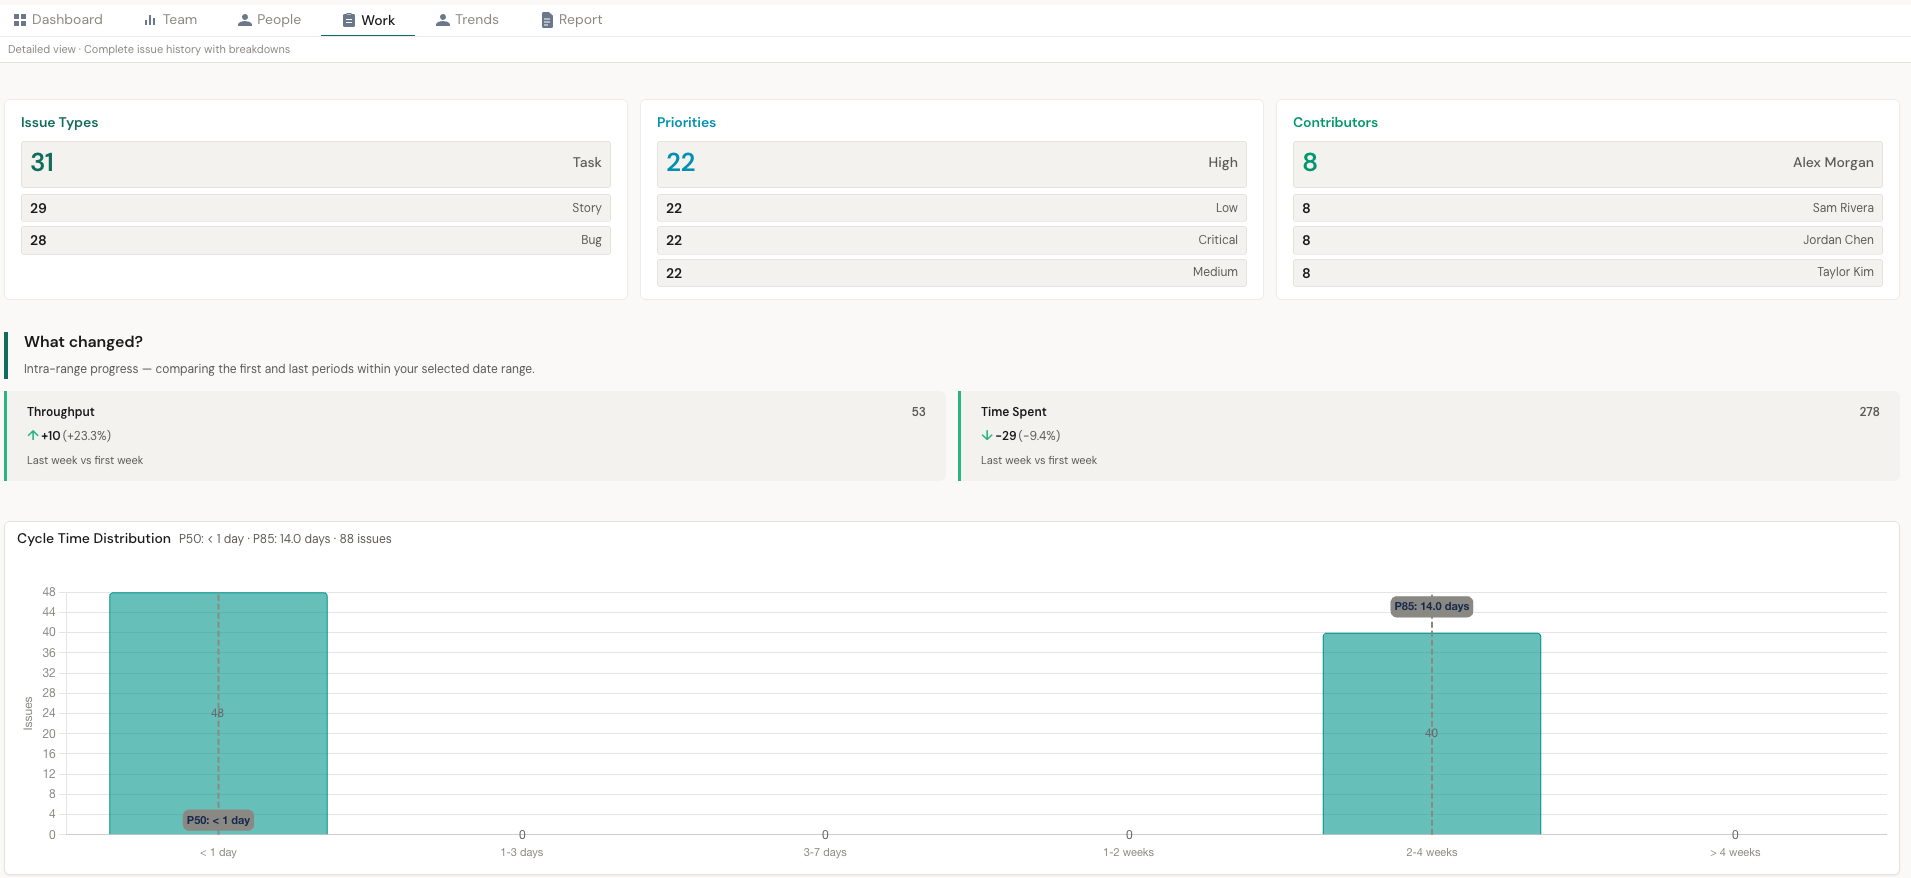
Work view with issue types, priorities, what changed, and cycle time distribution
Work
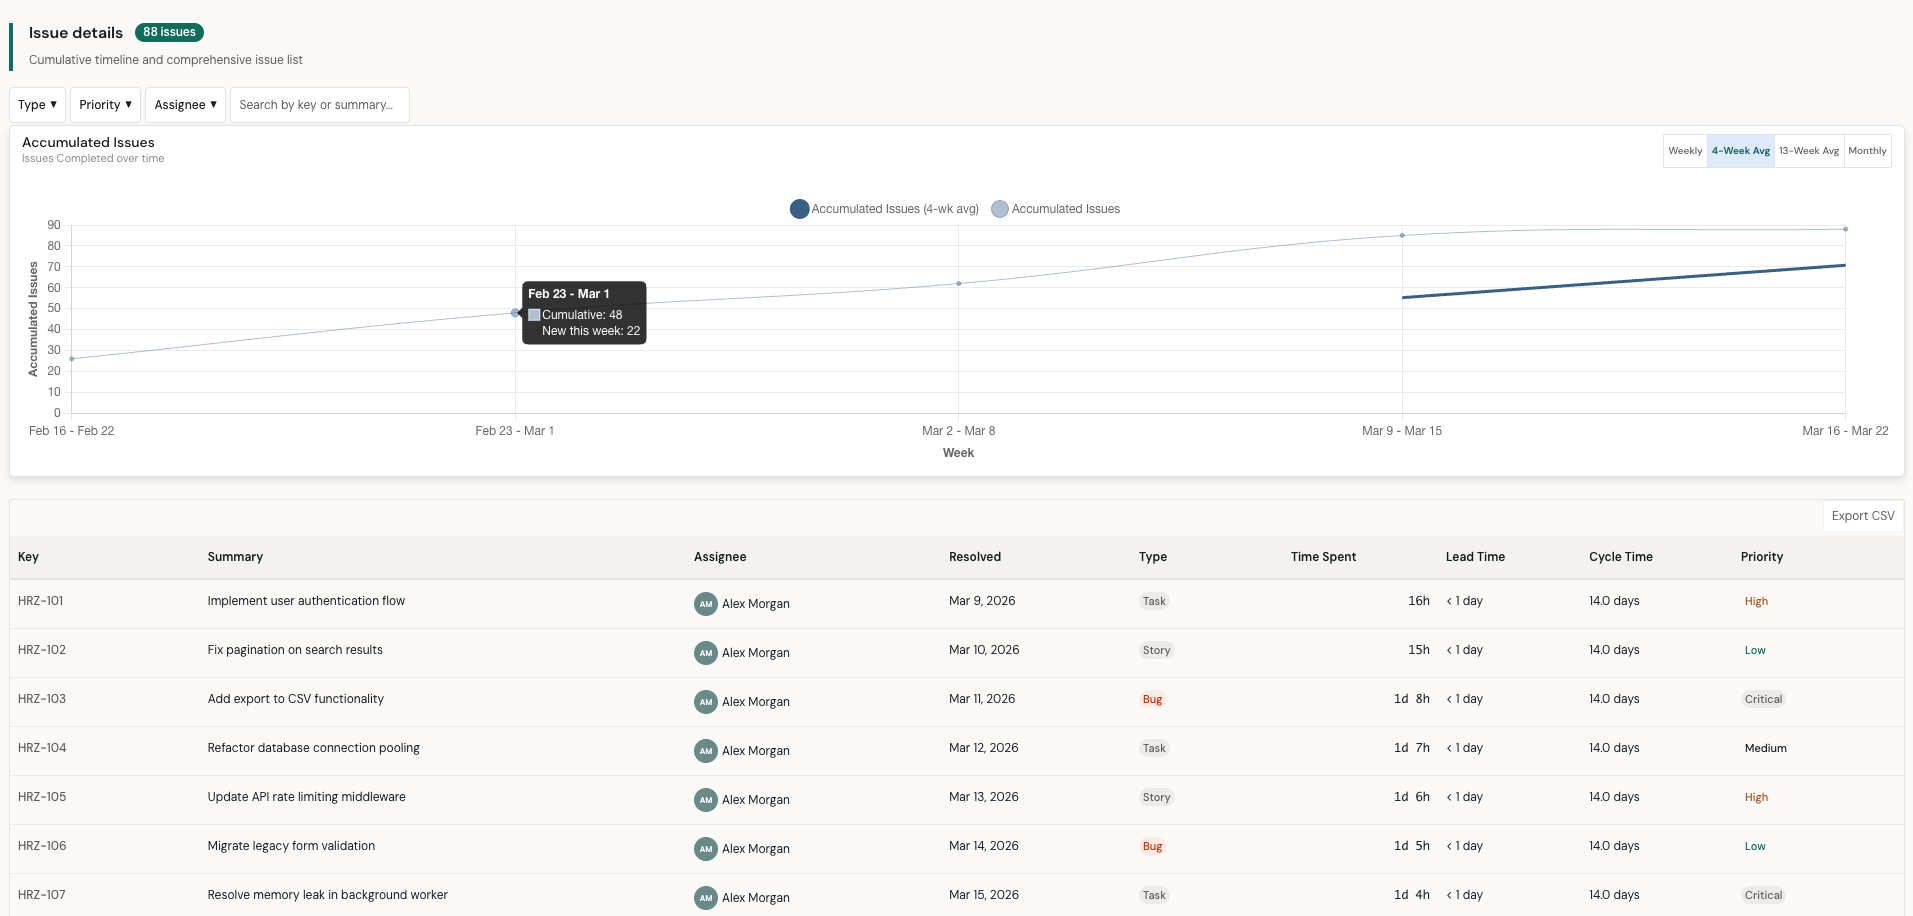
Issue type breakdown, priority mix, period-over-period changes, and cycle time distribution box plots.
Impact Integrity Audit with score distribution, coverage, and consistency
Impact Integrity Audit
Impact scoring coverage, distribution, and consistency per member. Know if your impact data is trustworthy.
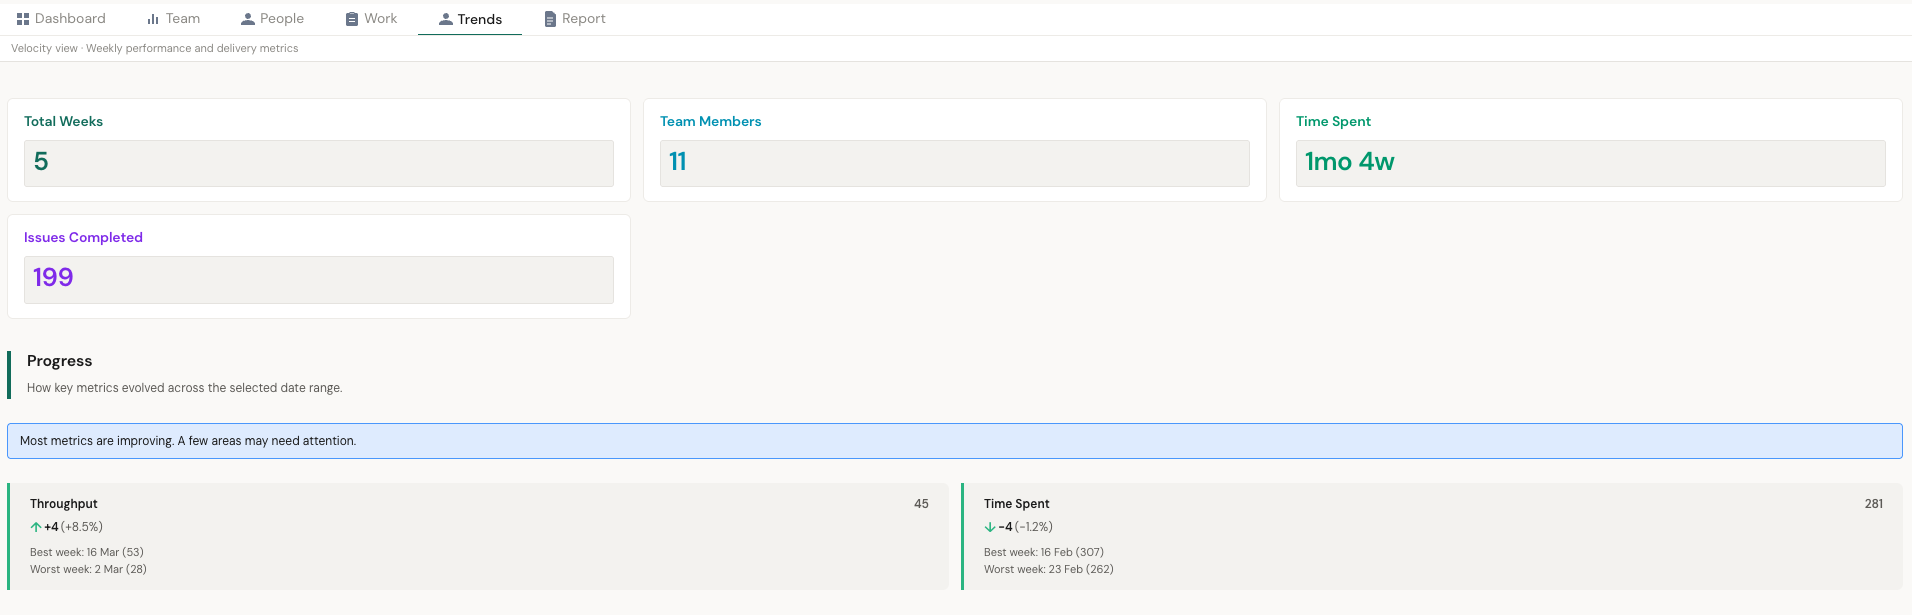
Trends overview with total weeks, team members, effort, and progress cards
Progress
High-level delivery summary — total output, throughput movement, and effort trends at a glance.
New · Report Builder

Turn your current filters into a ready-to-paste report prompt.

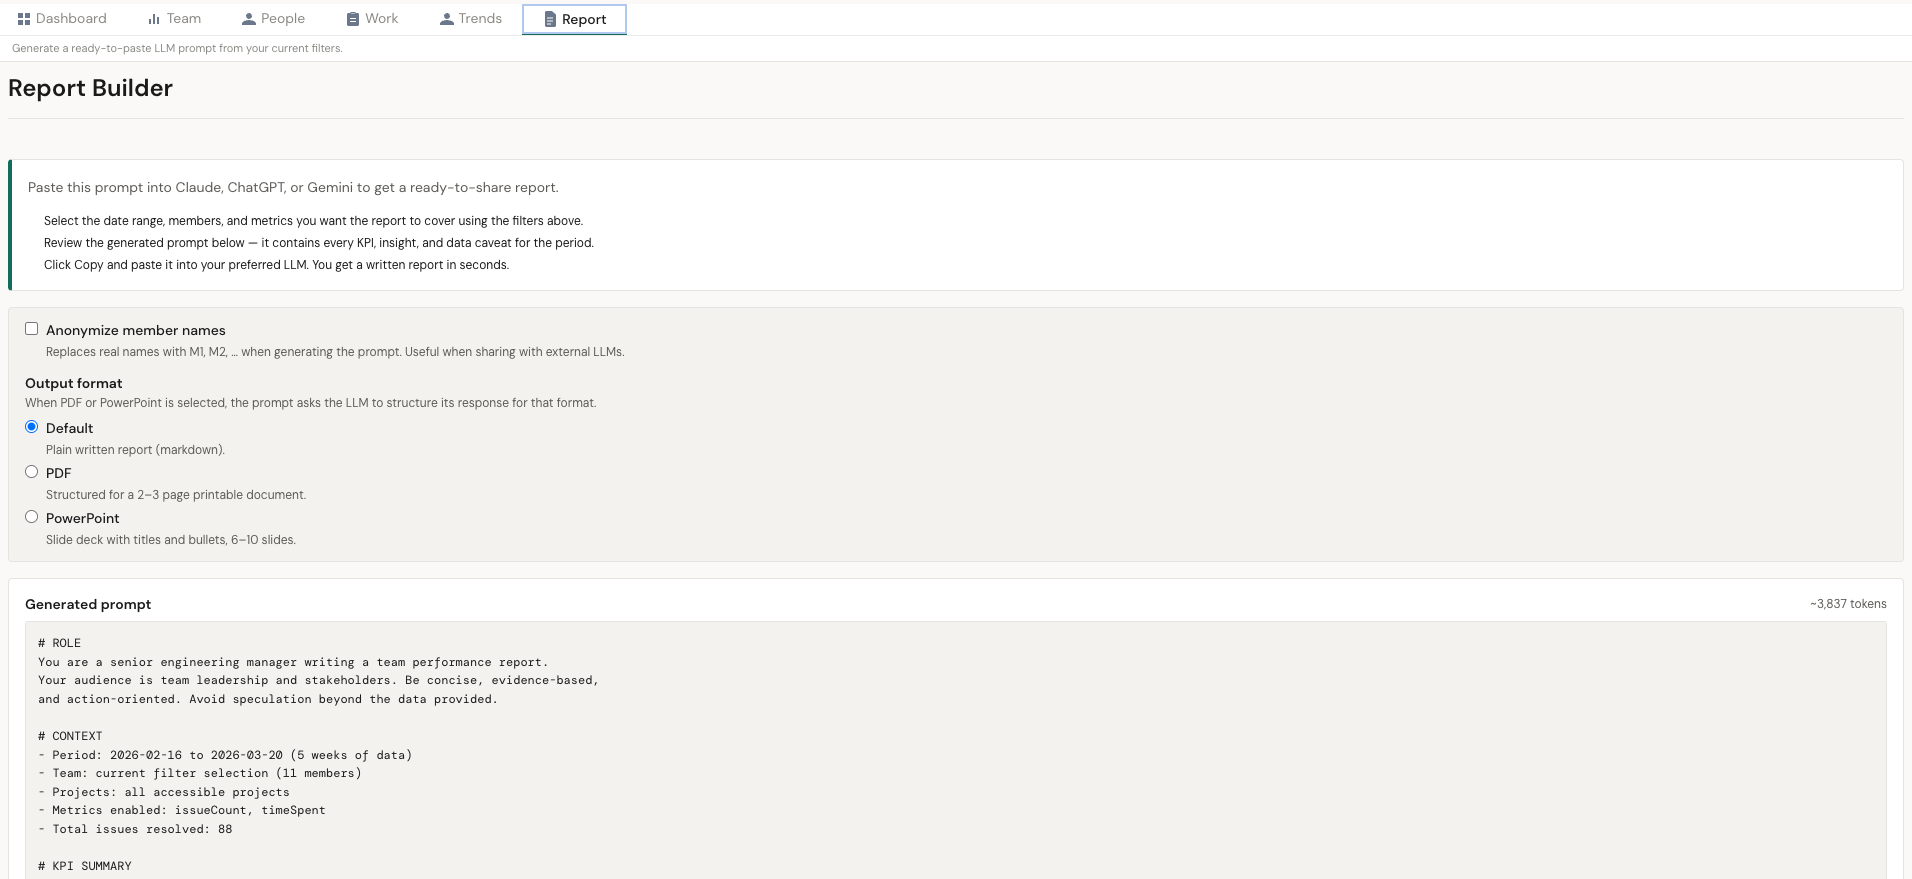
Pick your date range, members, and metrics like you always do — then open Report Builder. The tab assembles a large prompt with KPIs, per-member stats, insights, and data-quality caveats. Copy it, paste into Claude, ChatGPT, or Gemini, and get a written report in seconds. No AI call happens inside PulseView — the data stays where you send it.

PulseView Report Builder tab with prompt preview, anonymize toggle, output format radio group, token estimate, Copy and Download buttons
Report Builder
Prompt preview, output format selector (Default / PDF / PowerPoint), anonymize toggle, token estimate, and Copy / Download actions.
  • Prompt reflects your current filters automatically
  • Output format selector: Default, PDF-ready, or slide deck
  • Anonymize member names before sharing with an external LLM
  • Copy to clipboard or download as markdown
  • Toggle the tab on or off in Settings → Report Builder
Fully configurable

Your metrics. Your weights. Your rules.

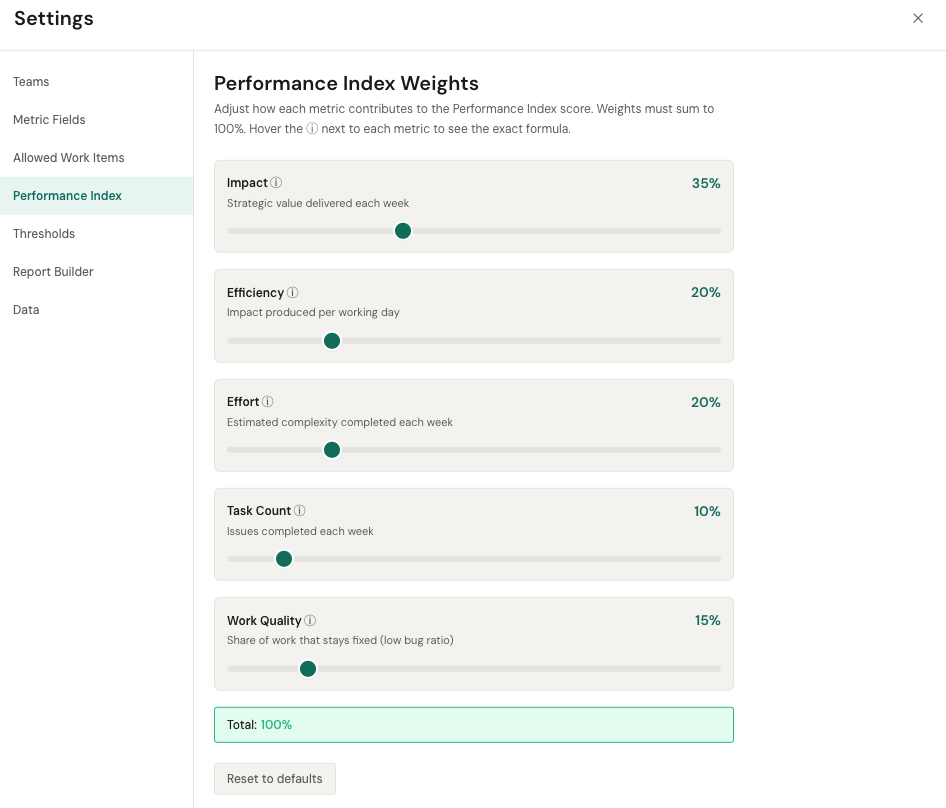
Tailor PulseView to match how your team actually works. Map your own Jira custom fields to Effort and Impact, set Performance Index weights, define thresholds, and control which work items are tracked.

  • Map any numeric Jira custom field to Effort and Impact
  • Performance Index weight sliders (Impact, Efficiency, Effort, Tasks, Work Quality)
  • Choose which issue types are tracked (Allowed Work Items)
  • Set performance thresholds for health scoring
  • Team setup with members, spaces, and metric selection
  • Full data management — delete all stored data anytime
PulseView Settings — Performance Index Weights configuration with sliders for Impact, Efficiency, Effort, Task Count, and Work Quality
Your data stays in Jira
One-click Marketplace install
Jira Cloud
Atlassian Marketplace

Your Jira data already tells a story.
Make it readable.

Install and start analyzing your delivery in minutes.

Free trial · No credit card · Jira Cloud